 English
 русский
 Español
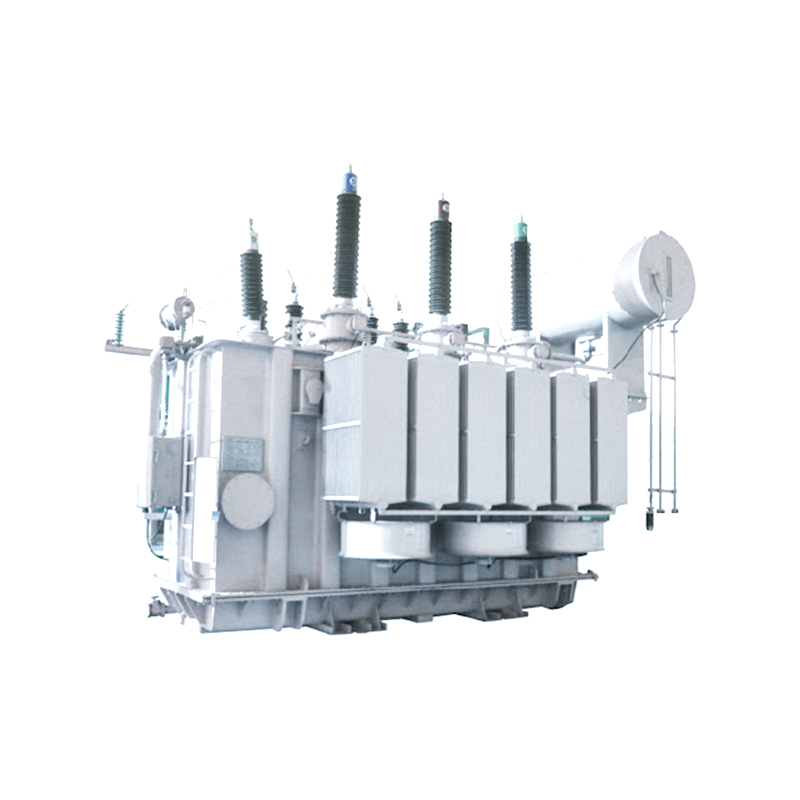
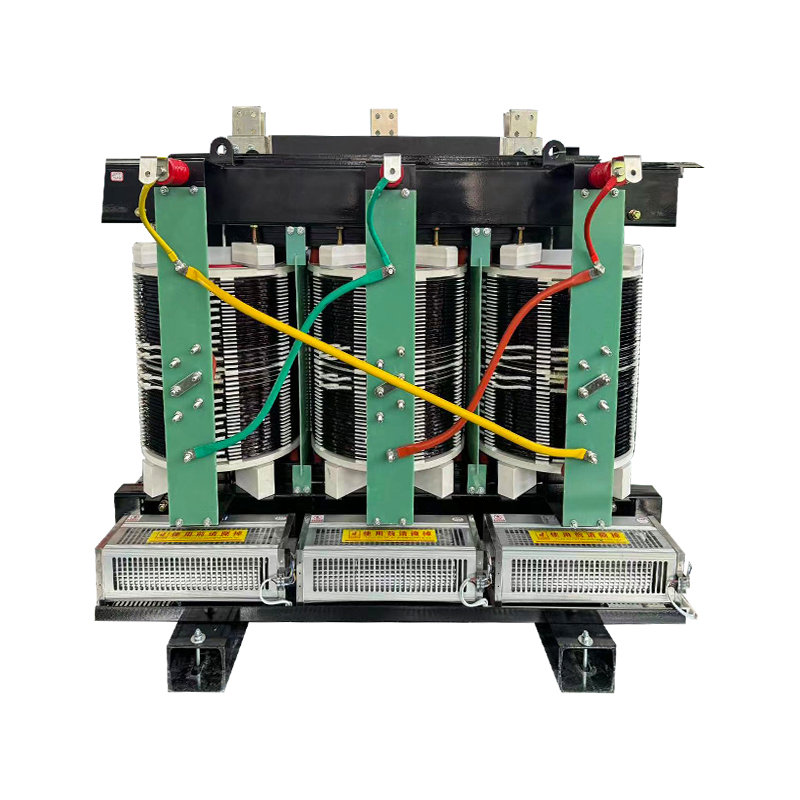
Three-Phase Transformer With Oil Pillow
630KVA 11KV
See Details
Content
A 40 MVA power transformer trips on differential protection after a close-in feeder fault. The oil tests clean. Winding resistance is within tolerance. Yet the maintenance engineer suspects something moved inside. That scenario — where electrical tests say "okay" but mechanical integrity is uncertain — is exactly where SFRA testing becomes indispensable.
Sweep Frequency Response Analysis maps the unique electromagnetic fingerprint of a transformer’s winding assembly. It measures the transfer function across a broad frequency sweep, typically from 1 Hz to 2 MHz. Any deviation from a known baseline fingerprint points to mechanical shifts: winding deformation, core clamping pressure loss, or even partial winding collapse. It is the only diagnostic that can catch these defects before they evolve into dielectric failure.
SFRA testing injects a low-voltage sinusoidal signal into one end of a winding and measures the amplitude and phase of the output at the other end, all while stepping through hundreds or thousands of frequencies. This produces a transfer function — essentially a plot of output voltage divided by input voltage (Vout/Vin) across the frequency range. Because every transformer has a distinct set of inductances, capacitances, and resistances shaped by its winding geometry and core arrangement, the resulting curve becomes its electromagnetic fingerprint.
Think of it as a precision echo test. Subtle winding movements — a hoop buckle after a high-current through-fault, a loosened clamping ring from road vibration during transport — alter those L, C, and R values enough to shift the frequency response. The technique is sensitive enough to detect changes well before they cause a short circuit or ground fault.
The frequency span is not arbitrary. The 1 Hz to 2 MHz range is chosen because it covers the frequency intervals where different physical parts dominate the response. Below 10 kHz, the magnetic core’s characteristics drive the shape. In the mid-band (roughly 10 kHz to 100 kHz), the overall winding structure — its bulk inductance and capacitance between windings and the core — comes through. Above 100 kHz, local winding details like inter-turn capacitance and minor deformations show up.
You do not run SFRA on every transformer every month. But there are three high-risk moments where skipping the test means accepting a blind spot that no other method will fill.
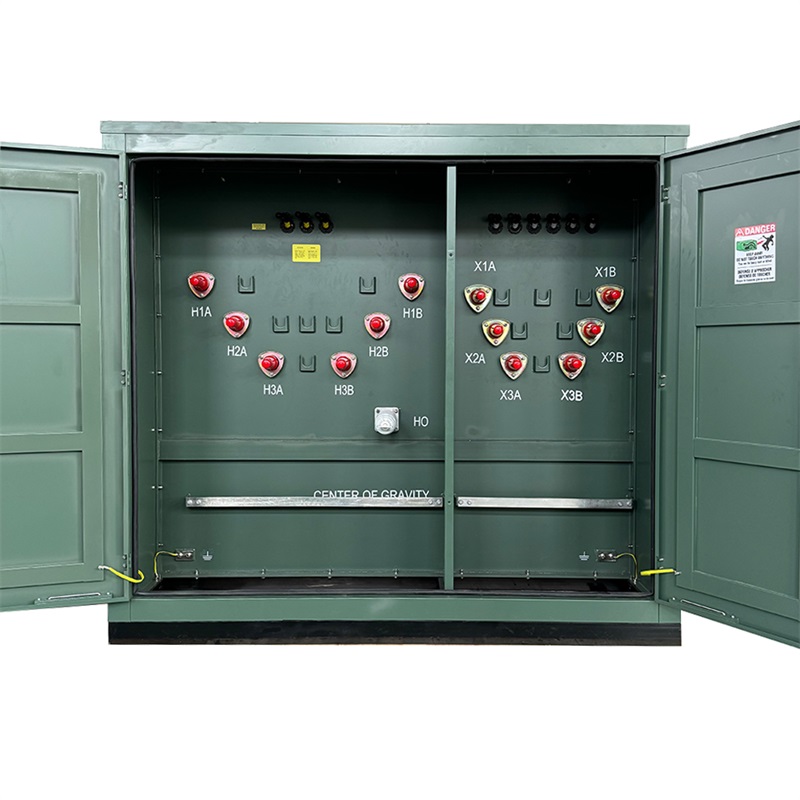
For a practical example: a 3750 kVA European pad-mounted substation transformer delivered to a Gulf-region project in 2024 was tested on arrival. The SFRA trace matched the factory baseline within 0.8 dB across all phases — confirming the shipment had caused no internal movement. That confidence let the commissioning team proceed without delay.
Engineers who learn to read SFRA traces zone by zone can pinpoint a fault’s likely location before opening the manhole. The test’s diagnostic power lies in how different frequency bands correspond to different structural elements.
| Frequency Band | Range | Dominant Physical Component | What a Deviation Indicates |
|---|---|---|---|
| Low Frequency | < 10 kHz | Magnetic core: permeability, core grounding, residual flux | Core deformation, loose core grounding, or changes in clamping pressure. Also sensitive to core magnetisation state. |
| Mid Frequency | 10 kHz – 100 kHz | Bulk winding structure: inductance between windings and core | Radial movement of windings, overall deformation of winding shape, shifted spacers. A shift here is a serious red flag. |
| High Frequency | > 100 kHz | Local winding geometry: turn-to-turn capacitance, lead positioning | Minor buckling, localized sag, or turn-to-turn short precursors. Even small dB changes can signal a developing fault. |
The shape of a deviation tells you as much as its location. A uniform shift across all bands often means a global change, such as winding movement along the core limb. A narrow-band dip that appears only at higher frequencies is far more likely to be a local turn-to-turn anomaly. When you see a low-frequency drop combined with a mid-band shift, suspect core loosening and winding deformation together — a pattern sometimes seen after a severe through-fault.
Comparing two traces — whether time-separated tests of the same unit, or phase-to-phase comparisons on a three-phase transformer — requires numeric criteria to turn a visual judgment into a maintenance decision. Industry practice coalesces around a few reliable thresholds.
A deviation of more than 3 dB in any frequency band, or a phase shift exceeding 10 degrees, is considered a “require attention” flag. This does not automatically mean the transformer must be taken out of service, but it demands a thorough review: check the consistency of the test setup, repeat the measurement, and cross-validate with other diagnostics such as winding resistance or DGA. If the deviation exceeds 6 dB, however, the situation is urgent. A >6 dB shift, especially in the mid-frequency band, correlates strongly with significant winding deformation. In that case, the transformer should be de-energized for a detailed internal inspection — lift the leads, possibly even extract the core for visual verification.
Equally important is the requirement for repeatability. According to IEEE C57.149, three consecutive measurements on the same tap and connection should match within 1 dB. If your readings drift more than that between successive sweeps, the root cause is almost always a poor connection, an unstable ground, or electromagnetic interference — not a transformer problem. Always chase repeatability before launching an investigation.
What about comparison cases where no baseline exists? Use the unit’s sister phases or an identical transformer from the same manufacturing batch. Phase A should overlay almost exactly with phases B and C, particularly in the mid and high bands. Discrepancies between one phase and the other two are a classic indicator of a winding-specific issue, while symmetric deviations across all three phases relative to a factory test often point to a core effect.
SFRA is sensitive — that’s its strength. But that sensitivity also makes it vulnerable to user error. These five mistakes appear over and over in field reports.
SFRA is powerful, but it is not a catch-all. It belongs in a diagnostic suite alongside tests that probe electrical and dielectric health. The table below clarifies where each method shines.
| Test | Detects | Sensitivity | Typical Duration | Relative Cost |
|---|---|---|---|---|
| SFRA | Winding deformation, core displacement, clamping loss | Very high (dB-level mechanical changes) | 45–90 min (full winding set) | Moderate |
| TTR (Transformer Turns Ratio) | Shorted turns, open circuits, tap changer alignment | Moderate (electrical turn count) | 15–30 min | Low |
| DGA (Dissolved Gas Analysis) | Thermal faults, partial discharge, arcing | High for active faults, slow for incipient mechanical issues | Oil sample only; lab turnaround 1–5 days | Low |
| Winding Resistance | Loose connections, broken conductor strands, tap changer contact wear | Moderate (resistance change) | 30–60 min | Low |
In practice, the most effective maintenance programs pair SFRA with DGA and TTR. DGA catches overheating and arcing that may not have caused measurable mechanical shifts yet. TTR flags shorted turns instantly — even one shorted turn changes the voltage ratio dramatically. But neither can see a winding that has deformed yet not shorted. SFRA fills that gap. A 110kV power transformer with a decent SFRA baseline, testable by any competent crew, can be kept in service years longer than one diagnosed solely by oil samples and electrical ratios.
Two standards frame all professional SFRA work: IEC 60076-18 and IEEE C57.149. They define the measurement techniques, the reporting requirements, and the criteria for judging a test as valid. Both require that the test frequency range extends from 20 Hz to 2 MHz at a minimum, though practical instruments often start at 1 Hz to capture core-related effects.
The key compliance point is the repetition test I mentioned earlier: three consecutive sweeps must show less than 1 dB deviation. That requirement is not a suggestion; it is a gate. If the instrument cannot achieve that repeatability, the data is not acceptable for any subsequent diagnostic decision. Many service companies now automate this check in their reporting software.
Beyond standards, best practice also means building a library. Every new transformer should leave the factory with a full SFRA baseline — all phases, all taps, both high-voltage and low-voltage windings. That baseline should be stored in a database accessible to the asset owner, not just the manufacturer. When the transformer arrives on site, the first thing the commissioning team does is rerun the same SFRA sequence and compare. After any major event, the comparison happens again. The result is a chain of fingerprints that makes fault calls objective.
Finally, test with the transformer off-line and fully isolated. Bushing test taps must be used, not the live bushings. The transformer’s tank must be solidly grounded. Any auxiliary equipment — busbars, cables, temperature probes — that could couple capacitively and distort the trace must be disconnected or accounted for in the test setup diagram.
SFRA testing turns mechanical unknowns into measurable data. It catches what electrical acceptance tests miss and what oil samples only hint at after damage has progressed. But its value multiplies when it is systematic, not sporadic.
A practical program for any size fleet includes these steps:
When you purchase transformers built with mechanical resilience in mind — for example, designs using 45° fully mitered joints and robust core clamping — you start with a fingerprint that is inherently more stable over the unit’s life. That stability makes any future deviation even easier to interpret. Combine a well-constructed asset with a disciplined SFRA program, and you take a large step toward eliminating catastrophic mechanical failures from your power system risk register.
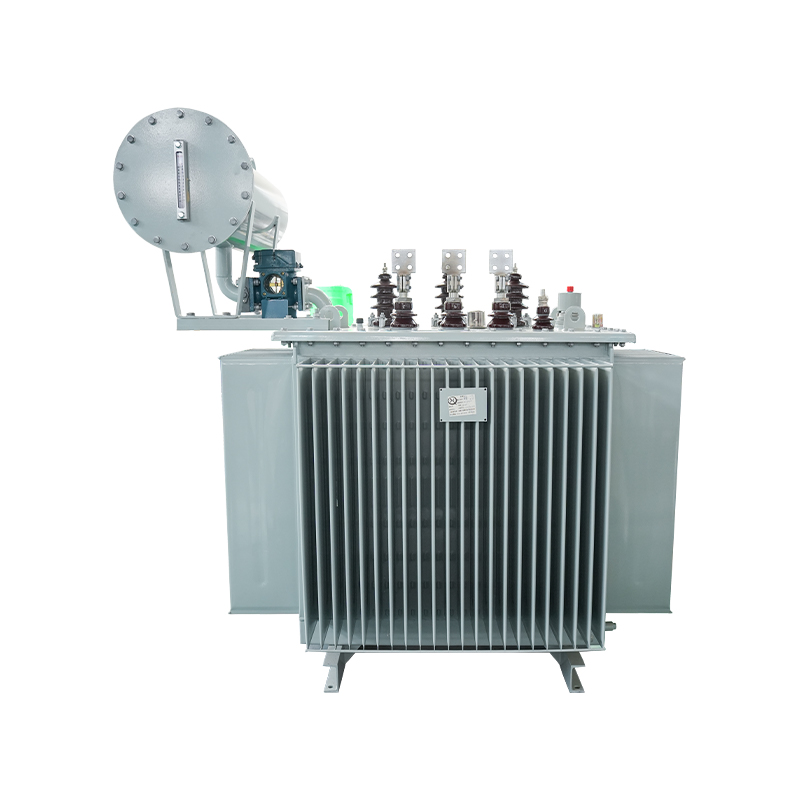
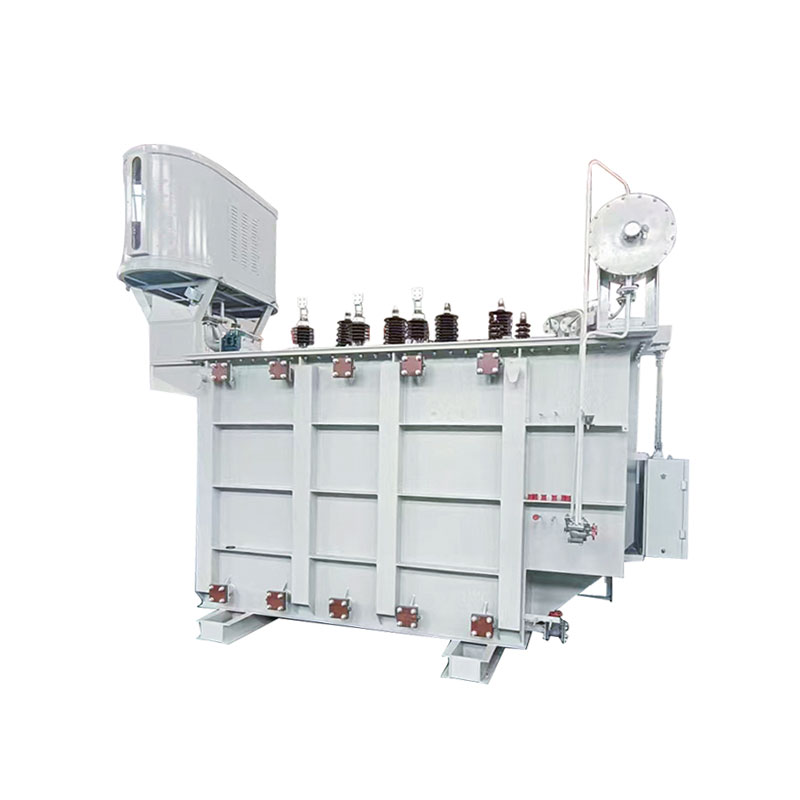
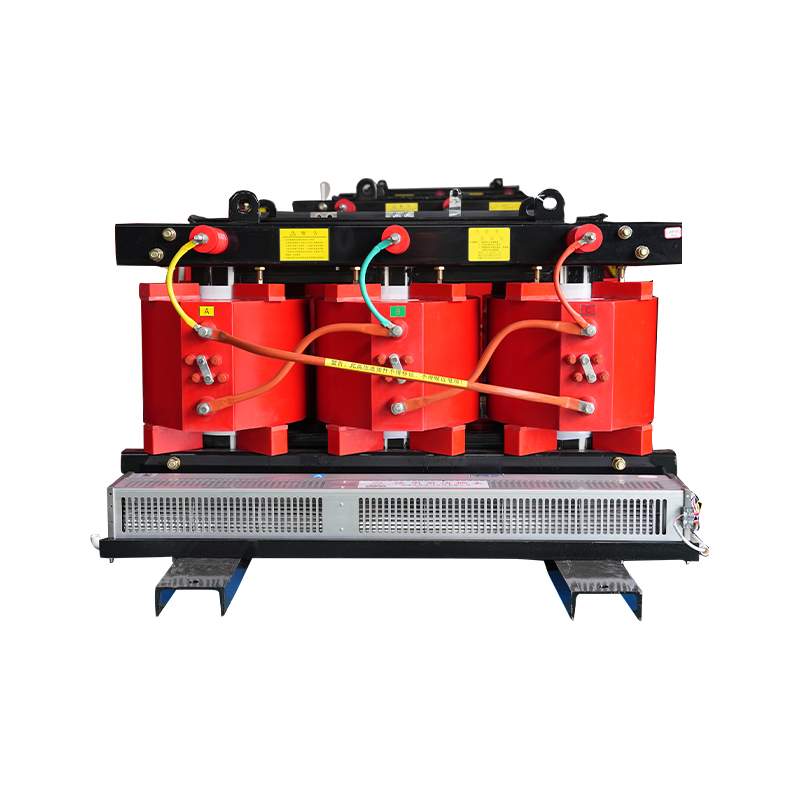
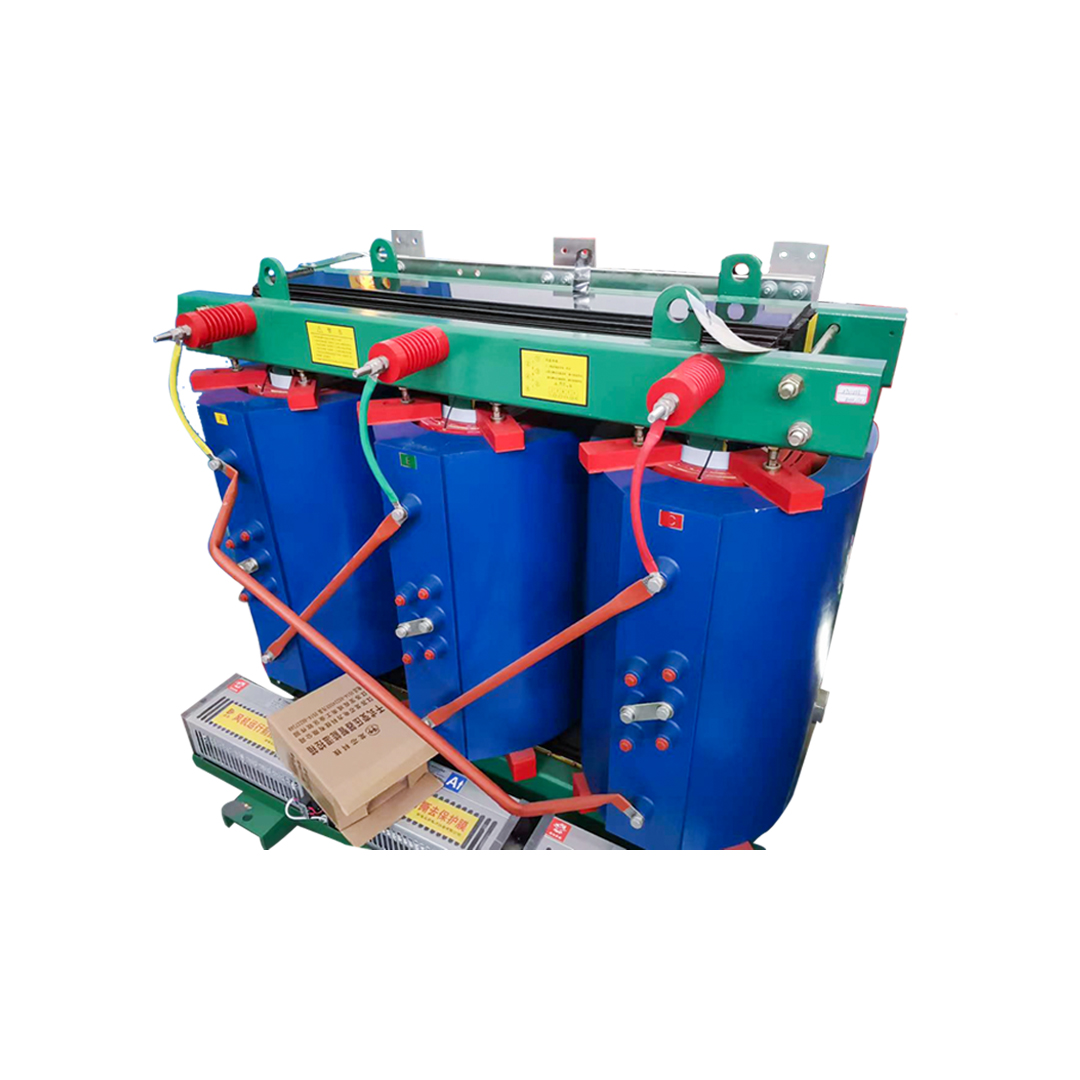
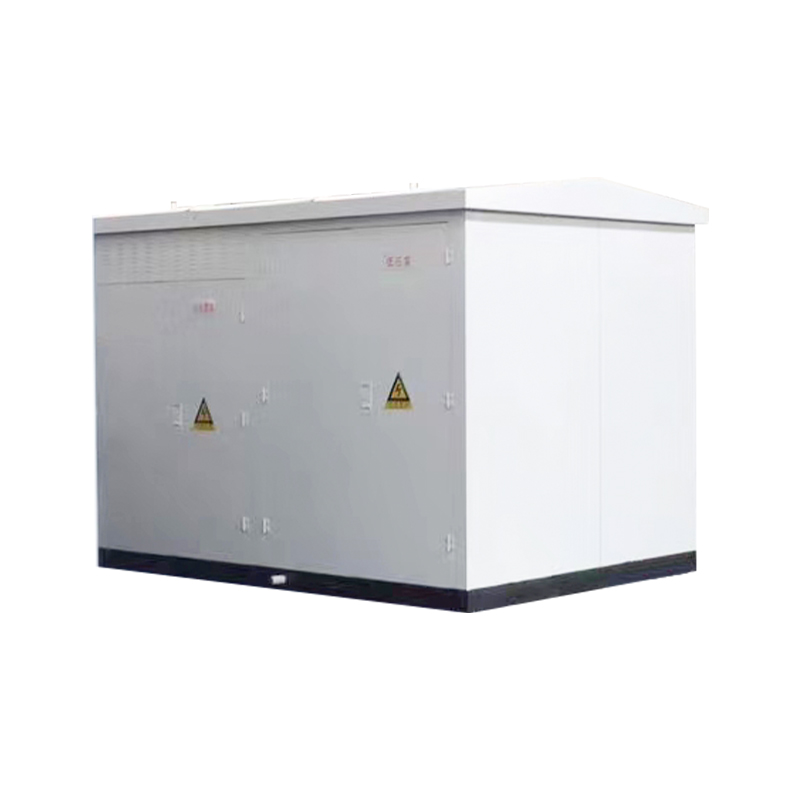
Base kVA: 45 kVA to 12,000 kVA Primary voltage: 2400 V to 46,000 V Secondary voltage: 120 V to 24,940V Basic lmpulse Level (BIL): 30kV to 250kV
See Details
Copyright © Jiangsu Dingxin Electric Co., Ltd. Rights Reserved.

Energy Efficient Transformers Manufacturers Electrical Transformers Factory
Contact Us