 English
 русский
 Español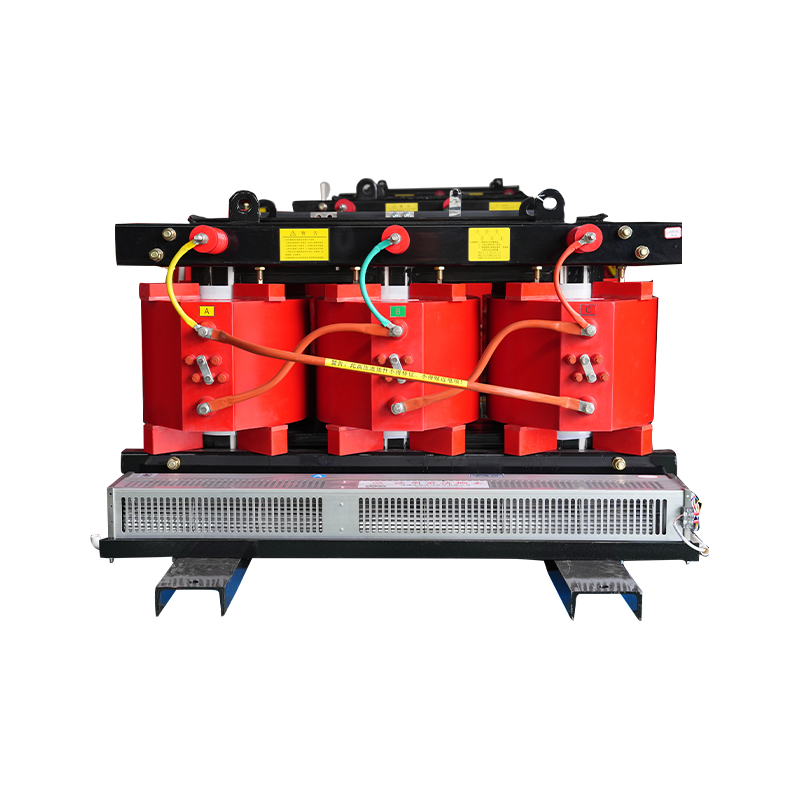
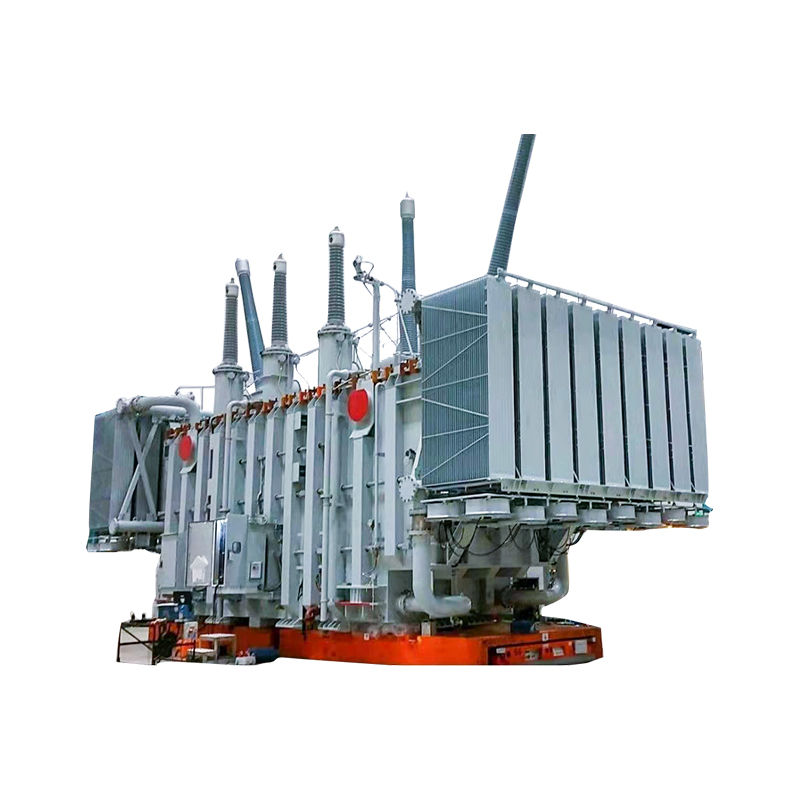
110kv Ultra-High Voltage Power Transformer
5MVA 110KV
See Details
Content
A 40-year-old power transformer still humming quietly in a substation while a 12-year-old dry-type unit fails without warning is not an anomaly. It is a direct result of design, insulation class, and operating conditions. The question of how long transformers last has no single answer, but the ranges below give you a reliable starting point based on decades of field data and manufacturer ratings.
Standard transformer insulation is designed for 180,000 hours of service at full load and a 98 °C hot spot temperature. That equates to 20.5 years of continuous operation under nameplate conditions. However, in practice, most units far exceed this. A study by TEPCO found that HV transformers in Japan reached 65 years on average, while distribution units hit 75 years when moisture ingress was kept low during manufacturing.
The table below distills expected service life across the four major categories. These ranges assume standard maintenance and typical loading profiles. Units in harsh environments (coastal salt spray, desert dust, high humidity) or those subjected to frequent overloads will fall toward the lower end; well-maintained assets in controlled conditions can push beyond the upper bounds.
| Transformer Type | Typical Lifespan (Years) | Typical Application | Primary Failure Mode |
|---|---|---|---|
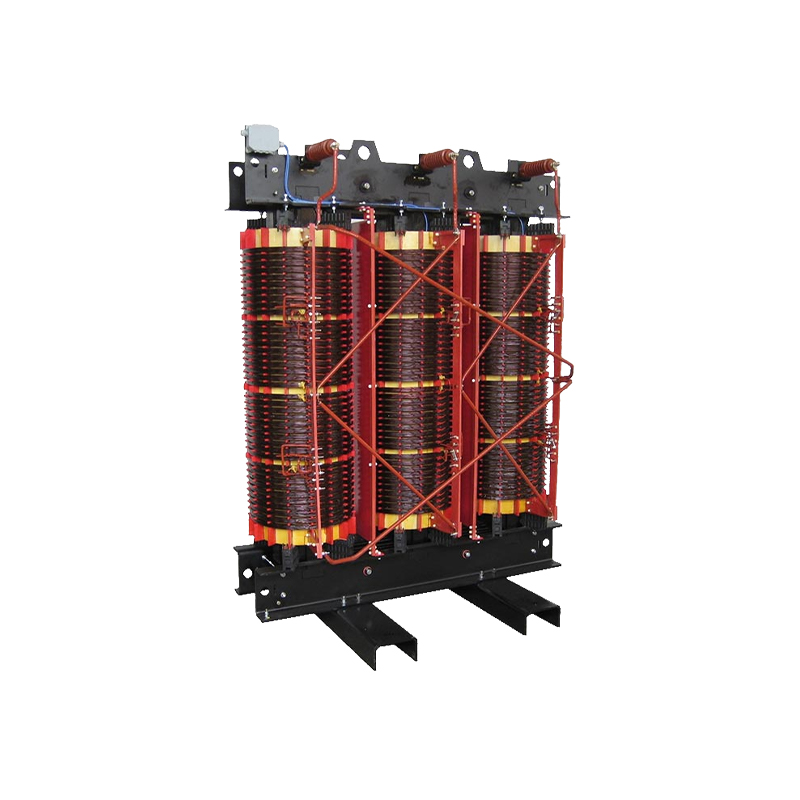
| Dry-Type Distribution | 20 – 30 | Commercial buildings, data centers, indoor substations | Epoxy thermal aging, partial discharge |
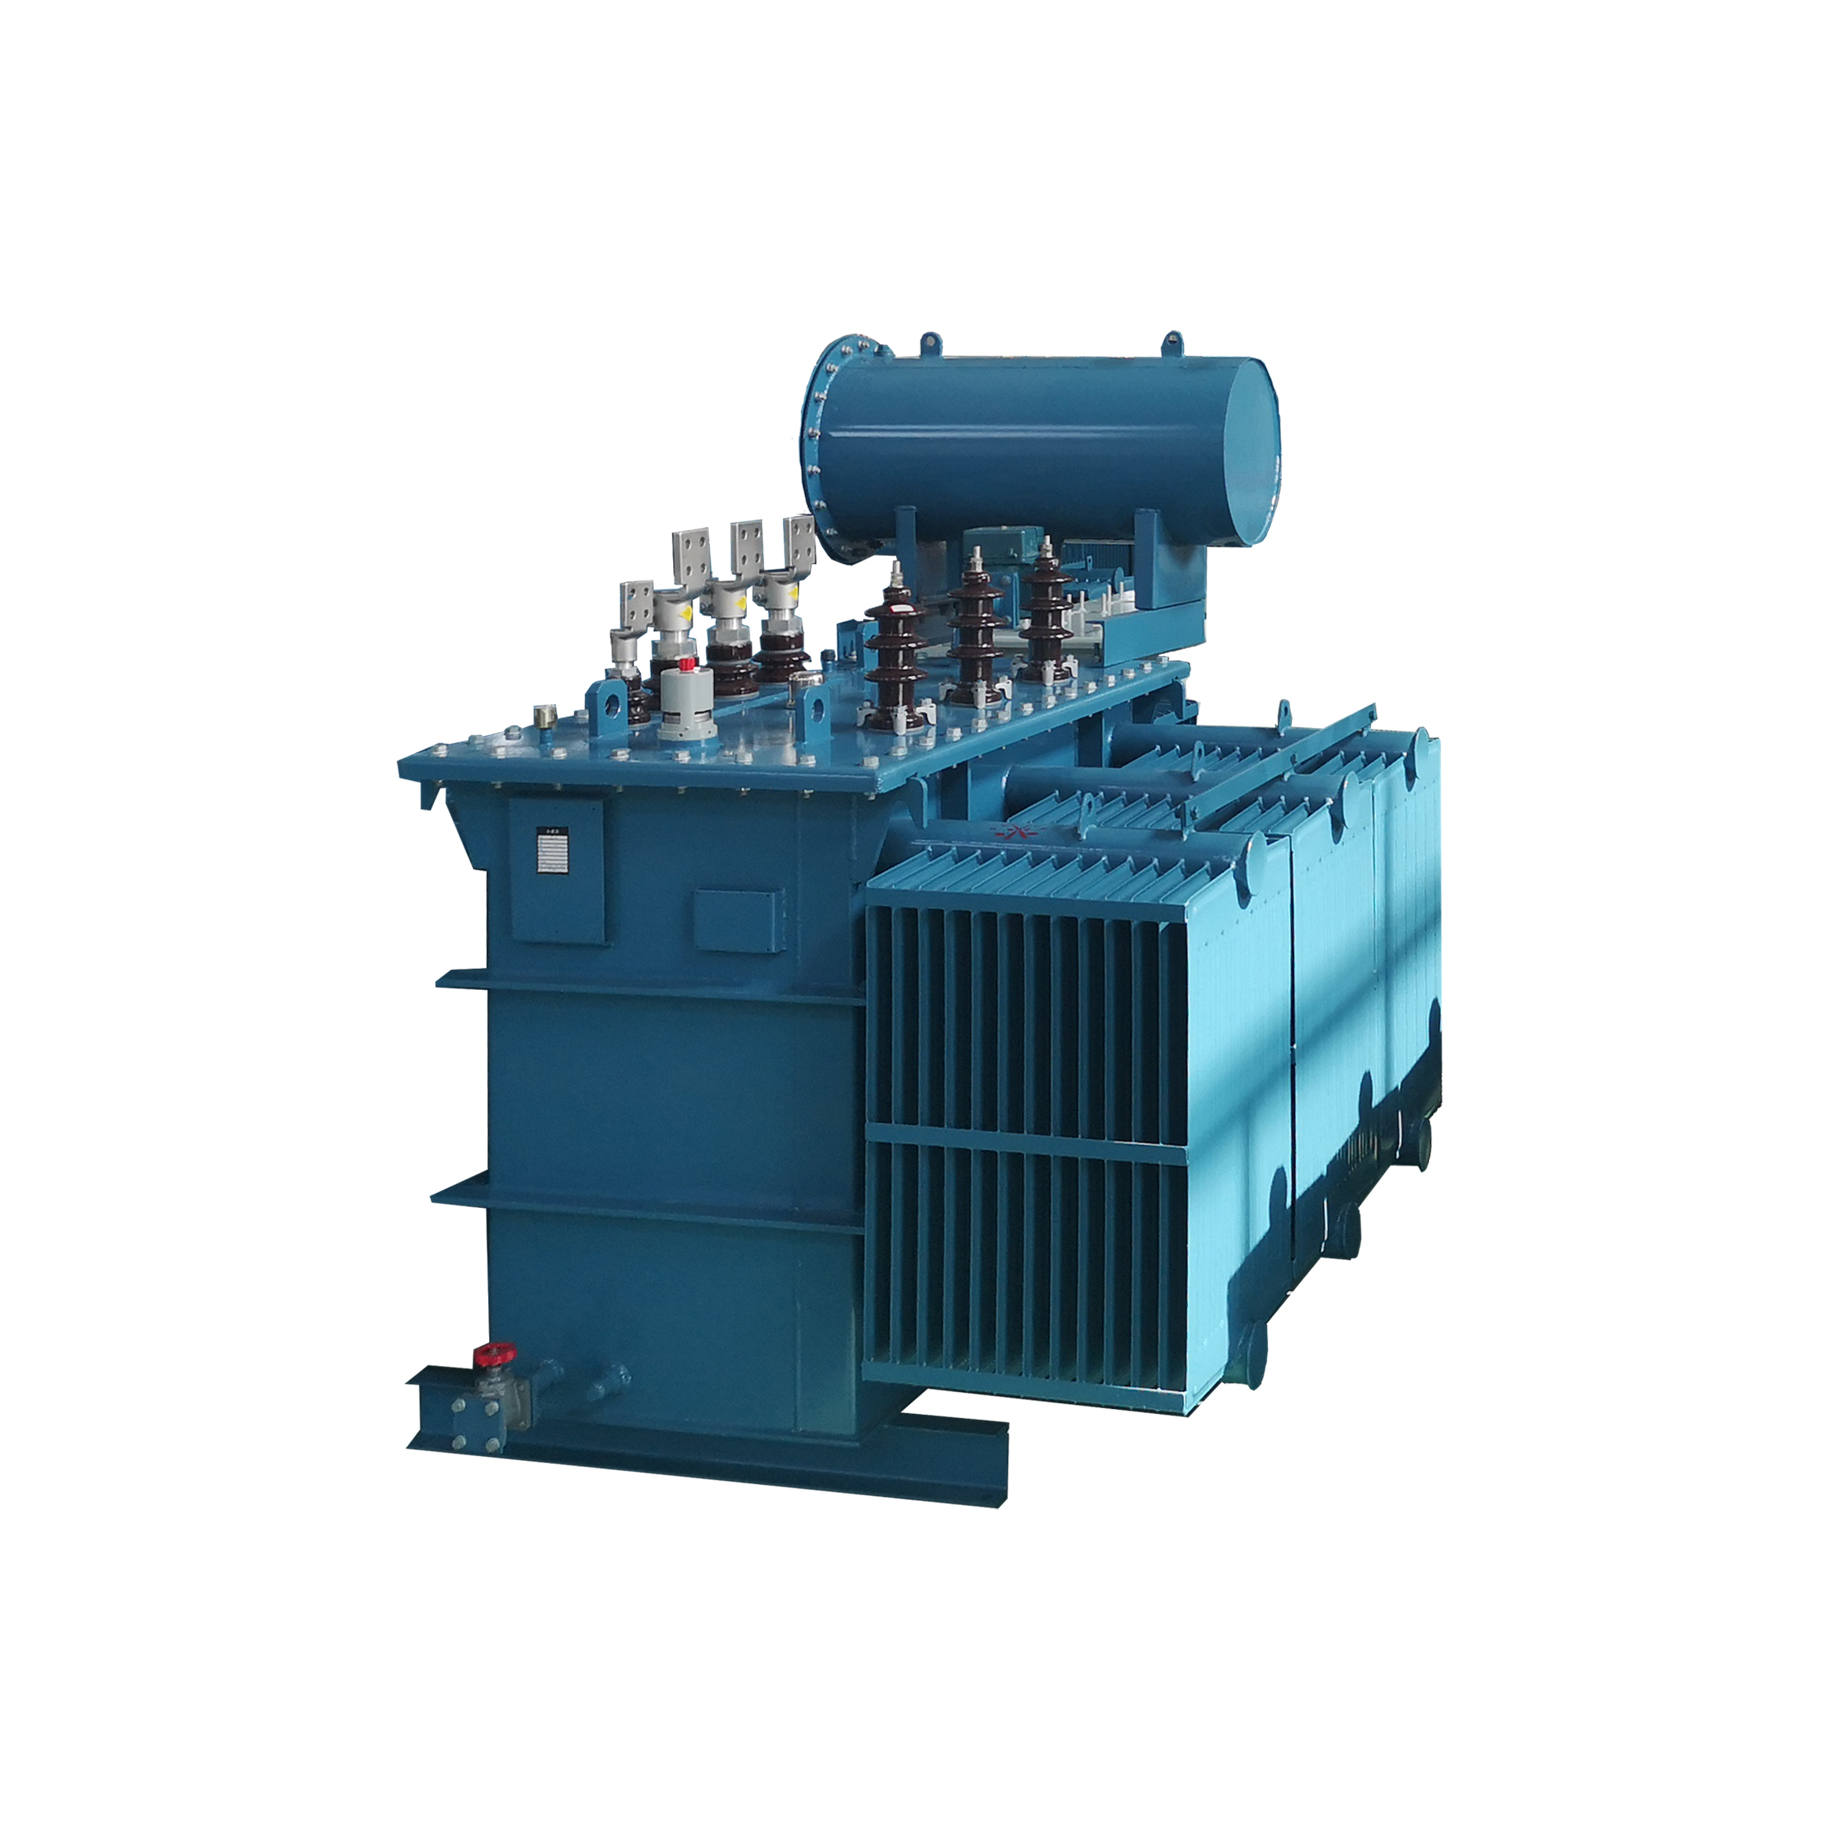
| Oil-Immersed Distribution | 25 – 40 | Utility distribution, industrial plants | Cellulose insulation degradation, moisture ingress |
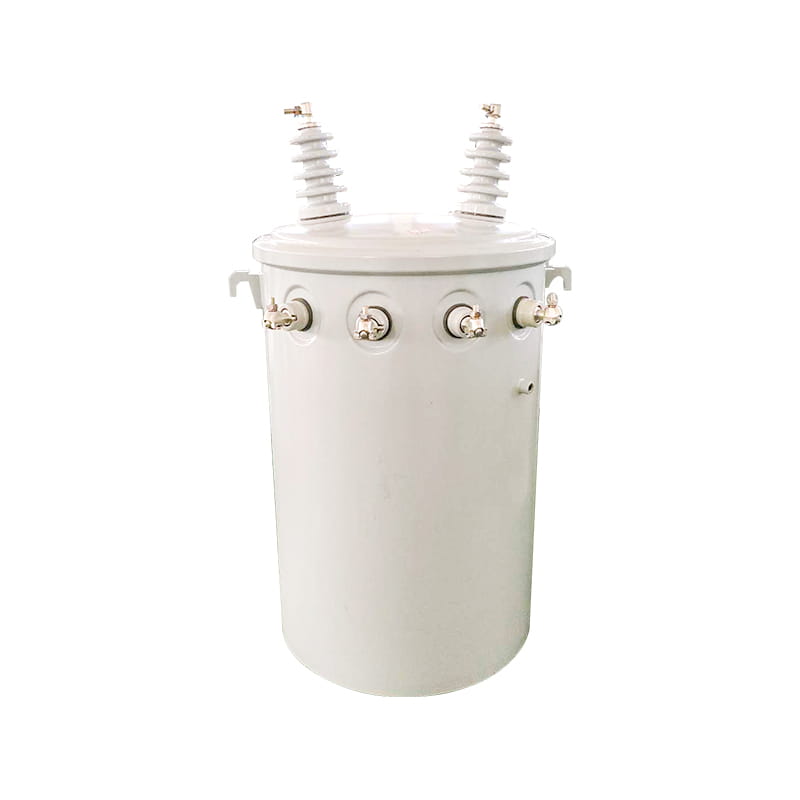
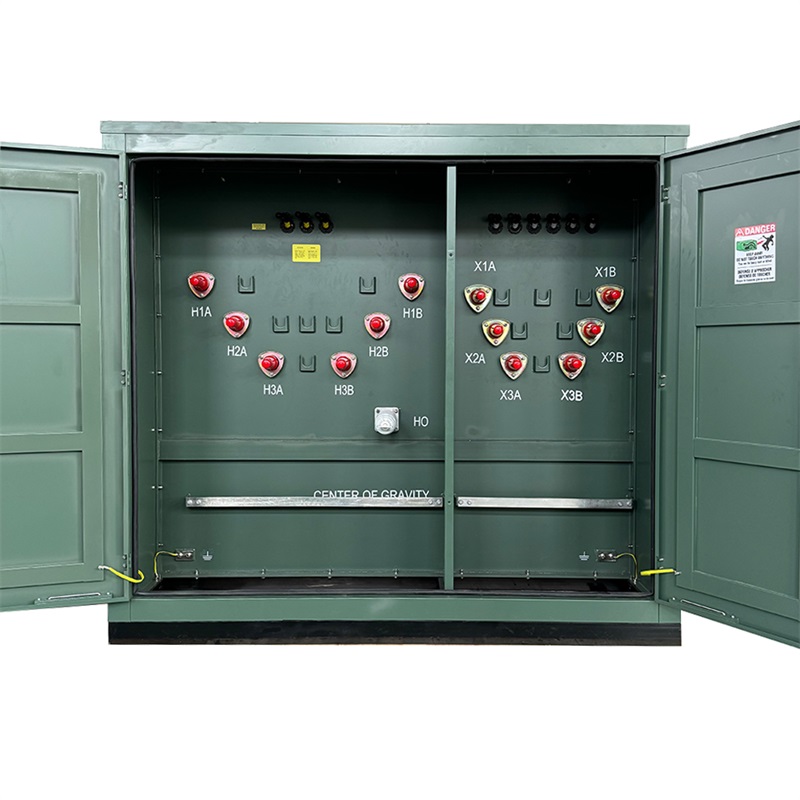
| Pad-Mounted (Oil-Filled) | 25 – 40 | Residential underground networks, commercial parks | Corrosion, wildlife intrusion, load cycling |
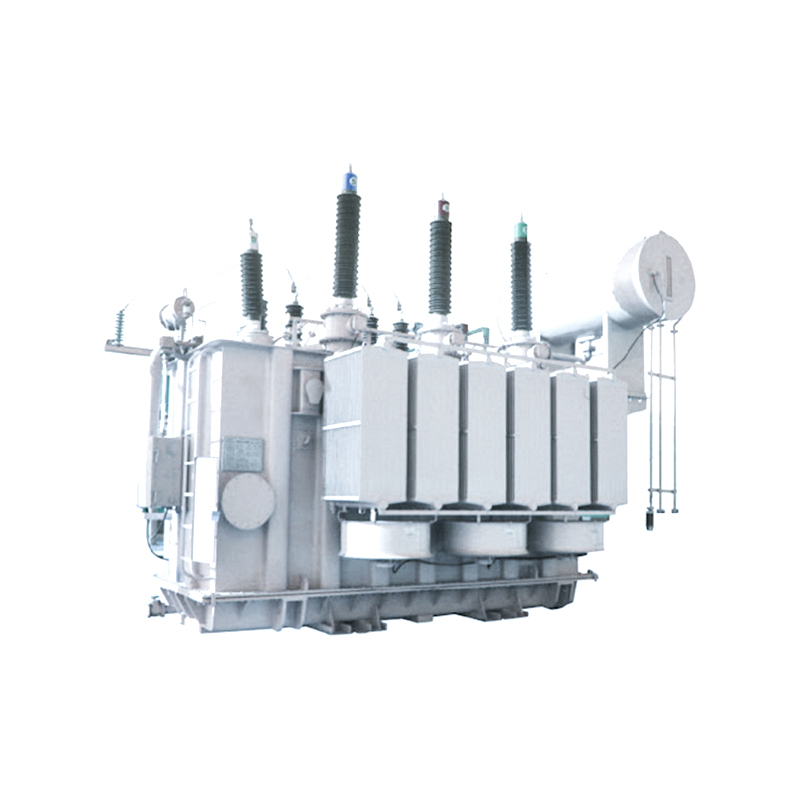
| Power (110 kV / 220 kV+ Oil-Filled) | 35 – 60 | Transmission substations, generation tie-lines | Winding clamping force loss, thermal hotspot aging |
The difference between a 30-year and a 60-year asset often traces back to three controllable variables: loading discipline, moisture exclusion, and maintenance frequency. Even a dry-type transformer can reach 40 years if loaded below 80% and kept in a clean, climate-controlled environment. Conversely, a poorly maintained oil-immersed transformer operating with elevated moisture and overload cycles can fail in under 15 years.
The most important number is not the nameplate age but the remaining insulation life. That is determined by the degree of polymerization (DP) of the cellulose paper or, for dry-type units, by thermomechanical integrity of the resin. We will quantify those thresholds later in this article.
Transformer aging is fundamentally a chemical reaction. For oil-filled units, the solid insulation—cellulose paper wound around the conductors—depolymerizes over time. The DP value of new paper starts around 1,000–1,200. At a DP of 450, tensile strength drops to 50% of its original value. At DP 250, the insulation becomes brittle, and the transformer is considered end-of-life because any through-fault current can cause mechanical failure.
Temperature accelerates this reaction according to the Arrhenius equation. IEEE C57.91 establishes that for every 6 °C rise in hotspot temperature, the aging rate doubles. Said differently, insulation life halves with each additional 6 °C. A transformer designed for a 98 °C hotspot at rated load will deliver its nominal 20.5 years of insulation life. If you can keep that hotspot at 92 °C (a mere 6 °C drop), expected life jumps to 41 years. Push it to 104 °C, and you are down to 10 years.
Load level translates directly to hotspot temperature. The relationship is not linear, but the table below illustrates the dramatic effect of operating below or above nameplate rating.
| Load (% of Rating) | Approx. Hotspot Temp (°C) | Aging Acceleration Factor | Insulation Life Expectancy (Years) |
|---|---|---|---|
| 50% | 80 | 0.125x | 164 |
| 80% | 86 | 0.25x | 82 |
| 100% | 98 | 1.0x (baseline) | 20.5 |
| 120% | 110 | 4.0x | 5.1 |
| 140% | 122 | 16.0x | 1.3 |
These numbers explain why two identical transformers installed the same year can have service lives that differ by decades. One heavily loaded unit ages 16 times faster than a lightly loaded counterpart. The 20.5-year baseline is not a guarantee; it is the starting point. The operator determines the slope of the aging curve from day one.
Moisture acts as a catalyst, further accelerating depolymerization. Paper with 2% moisture content ages 10–20 times faster than paper with 0.5% moisture. For this reason, keeping the transformer sealed, the conservator diaphragm intact, and the silica gel breather active is not optional; it is a direct investment in added decades of service.
Even a well-built unit can fail prematurely when one or more of the following factors go unchecked. Each factor carries a quantifiable penalty and a straightforward prevention method.
Problem: Routine loading beyond nameplate capability drives hotspot temperatures above the design ceiling. A 10% sustained overload can push the hotspot to 110 °C or higher, quadrupling the aging rate. Thermal runaway becomes a real risk in older units with degraded cooling systems.
Impact: IEEE data shows that for a 12 °C hotspot increase, insulation life drops to 25% of design value. In practical terms, a transformer expected to last 30 years may fail in 7–8 years under chronic 10–15% overload.
Prevention: Install fiber optic temperature sensors directly in the windings to measure real hotspot temperature. Do not rely on top-oil thermometer approximations. Set load-shedding triggers at 105 °C and enforce seasonal load limits based on ambient temperature.
Problem: Water enters through leaky gaskets, degraded breather desiccants, or improper storage. Once inside, it migrates from oil into cellulose paper, where it catalyzes acid formation and accelerates depolymerization.
Impact: When paper moisture content reaches 2%, aging rate accelerates by a factor of 10–20. At 4%, the transformer can lose 80% of its remaining life within months. Even a single day with an open manhole in a humid environment can saturate the insulation to damaging levels.
Prevention: Run dissolved gas analysis (DGA) at least annually to monitor moisture in oil. Replace breather desiccant when 30% of the indicator turns pink. Use online moisture-in-oil sensors for critical units; a sudden 10-ppm rise in water content warrants immediate investigation.
Problem: Rectifiers, variable frequency drives, and arc furnaces inject harmonic currents into the transformer. These currents increase eddy-current losses in windings and structural parts, generating extra heat without a corresponding increase in useful output power.
Impact: A total harmonic distortion (THD) of 20% can raise effective load losses by 15–25%, forcing operation at a higher internal temperature than the nameplate kVA suggests. Over time, this unnoticed overheating strips years of life from the insulation.
Prevention: Specify K-factor rated transformers or harmonic mitigating designs when non-linear loads exceed 15% of total capacity. Install harmonic filters on the secondary side. Include infrared thermography scans in quarterly inspections to detect hot spots invisible to standard winding thermometers.
Problem: Every external short circuit subjects the windings to intense electromagnetic forces. Even if the breaker clears the fault in cycles, the mechanical stress accumulates. After a few dozen through-faults, the winding can deform or the clamping pressure can drop below safe levels.
Impact: A single severe through-fault can reduce clamping force by 10–15%. Once clamping force drops too low, the transformer cannot withstand the next fault. The TEPCO study cited earlier confirmed a close correlation between CO₂ + CO generation and reduced winding clamping force.
Prevention: Perform frequency response analysis (FRA) or sweep frequency response testing (SFRA) every 5 years or after any major downstream fault. Maintain incident records; if through-fault count exceeds the transformer's design limit (typically 10–15 severe faults), schedule a full diagnostic review.
Problem: Skipping oil sampling, ignoring rising acetylene levels, and allowing cooling fans or pumps to fail gradually turns a manageable situation into a catastrophic failure.
Impact: Studies show that utilities who adopt predictive maintenance see transformer failure rates drop by 40–60% compared to those relying on run-to-failure strategies. The cost ratio is stark: a $5,000 DGA test can prevent a $500,000 unplanned outage.
Prevention: Implement the maintenance schedule outlined in the next section. Treat every rising trend in combustible gases as an early warning, not a lab curiosity.
A disciplined maintenance regimen is the single highest-impact lever for extending service life. The following table organizes the essential tasks by frequency, detection method, and the thresholds that should trigger corrective action. The costs are approximate for a medium-sized distribution or power transformer up to 20 MVA.
| Task | Frequency | Key Indicator | Warning Threshold | Approx. Cost (USD) |
|---|---|---|---|---|
| Visual inspection & infrared scan | Monthly | Hot spots, oil leaks, corrosion | Hotspot >15°C above ambient | 200 – 400 |
| Oil sample DGA | Annual | Combustible gases, moisture | Total combustible gas >720 ppm; acetylene >5 ppm | 500 – 1,200 |
| Oil quality (dielectric strength, acidity) | Annual | Dielectric breakdown voltage, neutralization number | Acidity >0.2 mg KOH/g | 150 – 300 |
| Insulation resistance (PI) | Annual | Polarization index, dielectric absorption | PI <1.25 | 300 – 600 |
| Winding resistance & turns ratio | Every 3 years | Connections, tap changer contacts | Resistance deviation >2% from baseline | 800 – 1,500 |
| SFRA / winding deformation | Every 5 years | Winding geometry shifts | Correlation coefficient <0.6 vs fingerprint | 2,000 – 4,000 |
| Furan analysis (DP estimation) | Every 5 years | Cellulose degradation | 2-furaldehyde >4 ppm; DP <250 | 600 – 900 |
| Cooling system functional test | Every 6 months | Fan/pump current, thermal cutout | Motor current >10% deviation | 150 – 250 |
For pad-mounted transformers, the same principles apply, with extra emphasis on visual checks for animal intrusion and corrosion of the enclosure. Many premature failures in underground distribution networks start with a mouse nest or a rusty seam.
These tests are not just checkbox exercises. A rising acetylene trend on two consecutive annual DGAs, even if below the 5-ppm absolute threshold, demands investigation. That simple practice alone has prevented countless active-part failures in fleet management programs worldwide.
The shift from time-based maintenance to condition-based monitoring has been underway for two decades, but the technology has now matured to the point where it pays back its cost in a few years for any unit rated above roughly 5 MVA—or any transformer where an unplanned outage costs more than $50,000.
Online dissolved gas analysis (DGA) sensors that sample oil every four hours can detect incipient thermal faults months before they trip a Buchholz relay. A sustained rise in hydrogen and methane indicates a hot spot forming; ethylene and acetylene often follow within weeks. Early intervention at the hydrogen stage can limit damage to a simple de-gassing and minor repair instead of a full rewind.
Fiber optic temperature monitoring embedded directly in the windings removes the guesswork from hotspot estimation. Conventional top-oil thermometers routinely underreport the true winding temperature by 10–15 °C under dynamic loads. With real-time fiber data, operators can run closer to thermal limits without crossing them, effectively increasing asset utilization without sacrificing life.
The table below compares the operational and financial impact of traditional calendar-based maintenance versus a condition-based smart monitoring approach.
| Metric | Traditional (Time-Based) | Smart Monitoring (Condition-Based) |
|---|---|---|
| Unplanned outages per 10 years | 1.5 – 2.0 | 0.2 – 0.5 |
| Mean time between failures (MTBF) | 5 – 7 years | 15 – 20 years |
| Annual maintenance cost (inspection only) | $8,000 – $12,000 | $4,000 – $6,000 |
| Typical monitoring system investment | N/A | $35,000 – $60,000 |
| Payback period | N/A | 2 – 3 years |
The economics are compelling. When you factor in avoided outage costs and extended insulation life, the net present value of a monitoring investment often exceeds 4x the hardware cost over a 10-year horizon. For organizations managing fleets of dozens or hundreds of units, the difference in capital planning accuracy alone can justify the expense.
Not every aging transformer should be replaced. Some 50-year-old units with stable oil tests and intact DP values can serve another decade. Others, half that age, are ticking time bombs. The decision to retain, repair, or replace must rest on objective criteria.
Three dimensions define the decision matrix:
The table below codifies these inputs into a straightforward go/no-go guide. Use it during annual condition assessments.
| Condition | Assessment Finding | Recommendation |
|---|---|---|
| DP > 350 and furan < 2 ppm | Insulation in good condition | Retain, continue monitoring |
| DP 250–350 or furan 2–4 ppm | Moderate aging | Plan refurbishment or replacement within 3–5 years |
| DP < 250 or furan > 4 ppm | Critical aging | Replace as soon as scheduling permits |
| Repair estimate < 40% of new unit cost | Economically viable repair | Proceed with repair |
| Repair estimate 40–60% of new unit cost | Marginal economics | Evaluate remaining life; if >5 years, repair; otherwise, replace |
| Repair estimate > 60% of new unit cost | Uneconomical to repair | Replace immediately |
| Critical spares no longer available | Obsolete design | Replace, regardless of other indicators |
This framework prevents two common mistakes: replacing a perfectly serviceable unit out of calendar-age anxiety, and nursing along a degraded asset that is one fault away from a catastrophic failure. The data tells the story; the operator's job is to listen.

Copyright © Jiangsu Dingxin Electric Co., Ltd. Rights Reserved.

Energy Efficient Transformers Manufacturers Electrical Transformers Factory
Contact Us